Horn Noise FAQ
FRA developed a MS Excel spreadsheet model as a tool to assess noise impacts from train horns in the vicinity of highway-rail grade crossings. The model predicts noise levels to the side of the railway and the anticipated effects using FRA noise impact criteria.
Noise in our environment can be described by three characteristics -- loudness, pitch, and time variation. Loudness is the intensity of sound or sound energy, and is described in terms of decibels (dB). For example, the louder the sound, the greater the decibel value. Pitch is the note or wavelength of the sound. There are many high and low pitch sounds that are inaudible to people, but can be heard by other animals or measured by instruments. For example, train wheel rumble is a low pitch sound and a squeal is a high pitch sound. Time Variation is the pattern of the sound being described over time. Time variation is used in combination with loudness and pitch to determine the sound energy exposure from a particular noise during a period of time, such as a 24 hour day.
To understand community annoyance from noise in the environment, sound must be measured the way the human ear interprets sound. To accomplish this a descriptor called "A-weighted sound level," abbreviated "dBA" is used. The letter "A" indicates that the sound has been filtered to reduce the strength of very low and very high-frequency sounds, much as the human ear does. Without this A-weighting, noise monitoring equipment would respond to noise events people cannot hear, such as high-frequency dog whistles and low-frequency seismic disturbances. On the average, each A-weighted sound level increase of 10 decibels corresponds to an approximate doubling of subjective loudness. Various "A-weighted" descriptors are used to calculate noise exposure from a noise event, as follows:
The A-weighted Sound Level (dBA) describes the noise at any moment in time.
The Maximum Sound Level (Lmax) is the loudest part of a single noise event.
The Sound Exposure Level (SEL) describes the cumulative noise exposure from a single noise event for its entire duration. In calculating SEL the noise exposure is normalized to a time duration of one second so that different noise events can be compared in terms of their sound energy.
The Hourly Equivalent Sound Level (Leq (h)) describes the cumulative noise exposure from all events over a one-hour period.
The Day-Night Sound Level (Ldn) describes the cumulative noise exposure from all events over a full 24-hour period, with events occurring between 10 pm and 7 am increased by 10 dB to account for greater nighttime sensitivity to noise. Ldn is the descriptor most commonly employed in environmental noise assessments.
Train horns are installed on locomotives to warn motorists or pedestrians of an approaching train at a highway-rail grade crossing. In many geographic locations, and during much of the year, motor vehicles operate with windows rolled up, air conditioning systems and radios in use. Therefore, audible warning signals must be sufficiently loud to be perceived. Unfortunately, the locomotive horn can significantly disturb those living or working near highway-rail grade crossings. A comparison of general noise levels from various commonly-experienced noise sources in our environment as well as typical ambient noise levels in the last column are shown in Figure 1. For instance, the noise resulting from the sounding of train horns has a similar impact to that of low flying aircraft and emergency vehicle sirens.
The preferred descriptor for environmental noise assessments is the day-night sound level (Ldn). Ldn provides an accurate measure of the overall "noise climate"of an area. Rather than representing the moment to moment variation in sound levels, Ldn describes the cumulative effect of all noise sources over a longer period of time. Typical Ldn's in various areas are shown in Figure 2
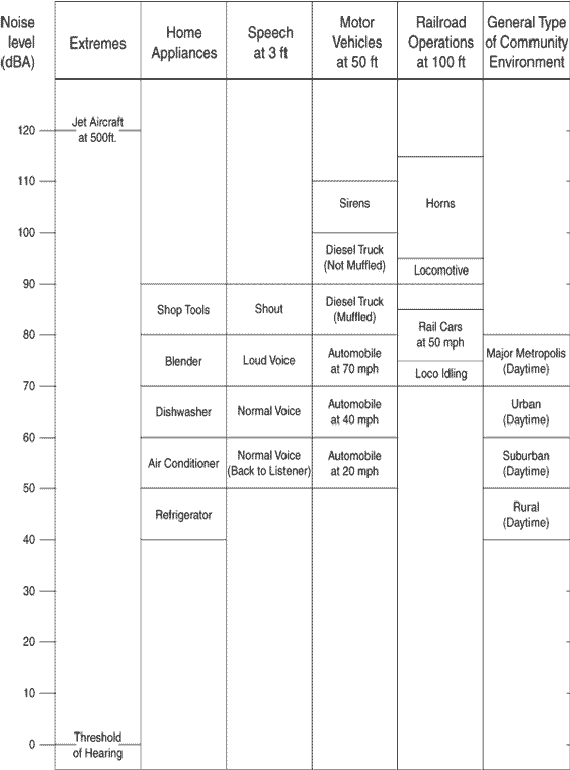
Figure 1. COMPARISON OF VARIOUS NOISE LEVELS
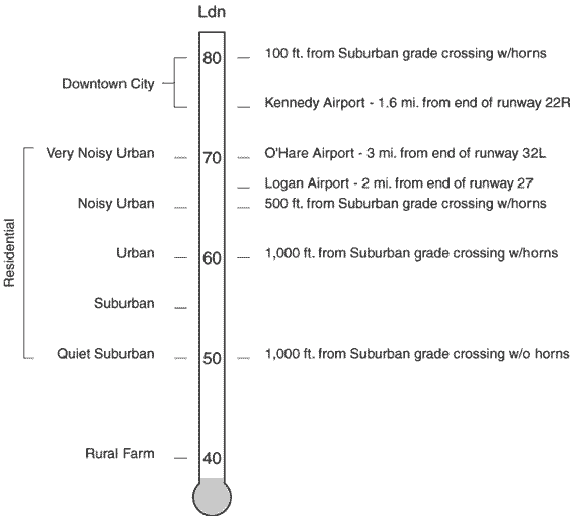
Figure 2. DAY-NIGHT SOUND LEVELS IN TYPICAL ENVIRONMENTS
(For example, noise from locomotive horns on a busy railroad at a 100 foot distance is somewhat louder than being 1 to 3 miles from the end of a busy airport runway, but at the 1000 feet away the train horn noise is similar to the average urban noise environment.)
Excessive noise has the potential to disrupt routine activities, which can affect the overall quality of life, especially in residential areas. In general, most residents become highly irritated/annoyed when noise interferes significantly with activities such as sleep, interpersonal or telephonic conversation, noise-sensitive work, watching television or listening to the radio or recorded music. In addition, some land uses, such as outdoor concert or pavilions or recreational sports venues , are inherently incompatible with high noise levels.
Human annoyance to noise in the environment has been investigated and approximate exposure-response relationships have been quantified by the Environmental Protection Agency (EPA). The selection of noise descriptors by FRA is largely based upon this EPA work. Beginning in the 1970s, EPA undertook a number of research and synthesis studies relating to community noise of all types. Results of these studies have been widely published and discussed, and are regularly cited by many professionals in the acoustics field. The basic conclusions of these studies have been adopted by the Federal Interagency Committee on Noise, the Department of Housing and Urban Development (HUD), the American National Standards Institute, and in some cases by international organizations and entities. Conclusions from this seminal EPA work remain scientifically valid to this day.
In a large number of community attitudinal surveys, transportation noise has been ranked among the most significant causes of community dissatisfaction in census surveys. A synthesis of many such surveys on annoyance appears in Figure 3. Different neighborhood noise exposures are plotted horizontally. The percentage of people who are highly annoyed by their particular level of neighborhood noise is plotted vertically. As shown in the figure, at 45 Ldn, the level of high annoyance in a community averages 0 percent. At 60 Ldn, approximately 10 percent of respondents reported being highly annoyed, while at 85 Ldn, the proportion of those being highly annoyed increases quite rapidly to approximately 70 percent. The scatter about the synthesis line is due to variation from person to person, community to community, and to slight differences among the various surveys.
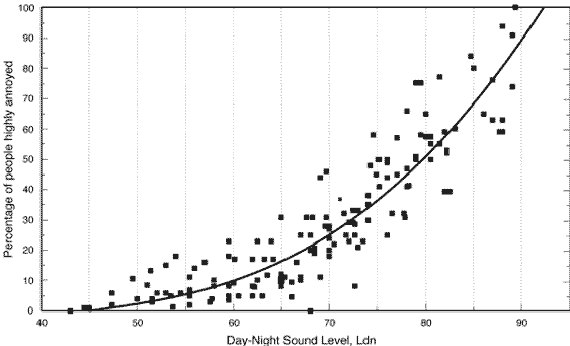
Figure 3. COMMUNITY ANNOYANCE DUE TO NOISE
Introduction of train horn noise may have two undesirable effects. First, it may significantly increase existing noise levels in the community beyond those to which residents have become accustomed. This effect is called "relative" noise impact. Evaluation of this effect is "relative" to existing noise levels. Relative criteria are based upon noise increases above existing levels. Second, newly-introduced horn noise may interfere with community activities, independent of existing noise levels. For example, it may be simply too loud to converse or to sleep normally. This effect is called the "absolute" noise impact, because it is expressed as a fixed level not to be exceeded and is independent of existing noise levels. Both of these effects, relative and absolute, enter into the assessment of noise impacts. These two types of impact, relative and absolute, are combined for use as the noise criteria shown in Figure 4.
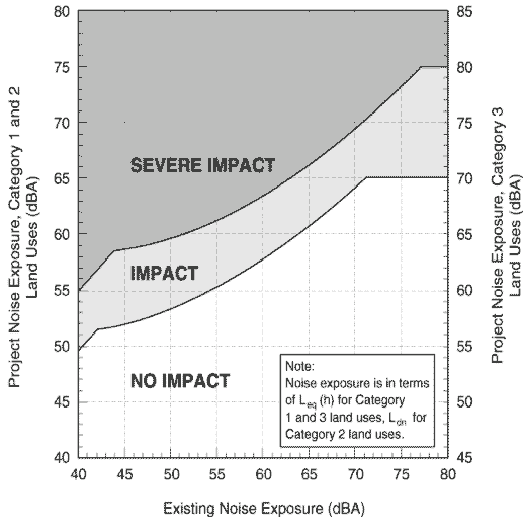
Figure 4. NOISE IMPACT CRITERIA
FRA's noise impact criteria are what is known as "ambient-based" criteria - they measure the impact of a change in the noise environment due to the introduction of a new noise source. As such, these criteria are ideal for determining the effect of re-introducing the sounding of the locomotive horn in urban and suburban communities where there was a previously existing whistle ban. For residential areas, the new noise environment with horns is computed in terms of Ldn and is compared with the prior ambient noise without horn blowing. The impact of the change in the noise environment is assessed and categorized as - No Impact, Impact, or Severe Impact.
The FRA noise impact criteria were originally developed by the Federal Transit Administration (FTA) for use in areas where new urban mass transit projects have been proposed. Other federal agencies utilize noise criteria that are oriented to the specific types of projects they evaluate or sponsor. However, none employ a sliding scale to assess a change in noise conditions and therefore cannot be compared directly with the FRA criteria. For example, the Federal Highway Administration (FHWA) has "Noise Abatement Criteria" which provide guidelines when the absolute noise level from a new highway approaches a level where mitigation should be considered. (FHWA does allow a state to include a significant change in noise level as part of the consideration but does not define what is "significant.") The Federal Aviation Administration (FAA) has identified several levels of aircraft noise that are compatible with various land uses - for example, in residential areas an Ldn of 65 dBA has been identified. FAA does provide for assessment of increases over existing conditions, but only two steps, one for inside and one for outside the 65 dBA contour.
The U.S. Department of Housing and Urban Development (HUD) is the only agency with an existing standard for a residential noise environment. As a qualifying condition for funding proposed housing developments, HUD defines what level of ambient noise at a proposed location is acceptable for residential land use. In the HUD Standards, Ldn below 65 dBA is considered "Acceptable," Ldn above 75 dBA is "Unacceptable," with ambient levels between Ldn 65 dBA and 75 dBA categorized as "Normally Unacceptable." The Normally Unacceptable rating does not disqualify a site from receiving HUD funds; rather, the development planned in such an area must incorporate suitable mitigation measures to provide a satisfactory interior environment.
The Federal Railroad Administration has developed a noise computation method to assess the noise impact of train horns in the vicinity of highway-rail grade crossings. This method uses a special train horn noise model to predict noise levels to the side of the railway which incorporates the FRA noise impact criteria.
Noise from horns is analyzed by considering the problem in terms of a Source-Path-Receiver framework. The Source generates close-by noise levels, which depend on the type of source and its operating characteristics. The Path of sound between the source and the receivers includes the intervening distance, obstacles, terrain features and structures. The Receiver is the noise-sensitive land use exposed to sound from the source. The FRA horn noise model incorporates all three elements of the noise analysis as they relate to train horns near grade crossings.
Reference Level. Although the maximum sound output of a horn can be determined in a laboratory, it is how the horn is sounded and perceived in the real world that determines its effect on the surrounding environment. Development of a source reference level to use in the horn noise model was based on field measurements at grade crossings from many railroads. Rather than employing a single reference level, a reference level that varies along the railroad beginning at 1/4 mile in advance and ending at the crossing was found to be more accurate. Field measurement data show an average Reference SEL of 107 dBA at 100 feet from the nearest track represents the horn noise in the distance from 1/4 mile to 1/8 mile from a crossing. Starting at the 1/8 mile point, the data show the horn is sounded more continuously, and more loudly, in the last part of the blowing sequence as the train reaches the crossing. Consequently, the SEL is assumed to increase linearly to 110 dBA at the roadways, as shown in Figure 5.
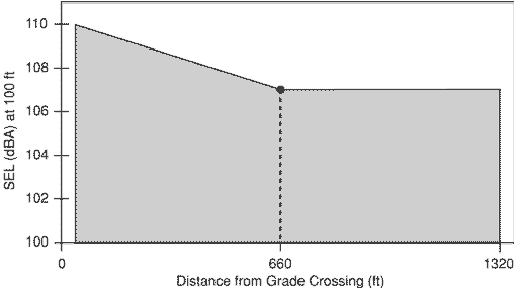
Figure 5. HORN SOURCE LEVEL MODEL
Day-night Sound Levels. The reference SEL and the number of train movements through a crossing during day and night are used as the basis for calculating the day-night sound level (Ldn) for assessment with the FRA noise impact criteria.
Sound propagation is the way sound spreads and dissipates from its source, and depends on several variables. The key effects of geometric spreading (divergence), ground effects, atmospheric effects, and shielding are built into the horn noise model as described in the following. The final result of the assumed propagation effects are shown in Figure 6.
Divergence . The sound from a horn is assumed to act as if it were emitting from a moving point source, which when averaged over the length of track looks like a line source. Therefore, there is a 3 dB reduction for every distance doubling applies.
Ground effect. The model takes into account a generalized soft ground condition such as grass or other vegetation, assuming that most grade crossings with whistle bans are located in residential areas. This assumption results in an additional 1.5 dB per distance doubling, resulting in a total of 4.5 dB reduction per distance doubling.
Atmospheric effects. The horn noise model does not take into account atmospheric effects such as air temperature and humidity, assuming that if averaged over an entire year, the average condition is a uniform, quiescent atmosphere.
Shielding. The model takes into account shielding from rows of buildings in a setting typical for urban and suburban grade crossings where whistle bans are likely to be in effect. Based on surveys, a reasonable assumption for a national average is that the first row of buildings occurs at 200 feet from the tracks, with succeeding rows of buildings at 200 foot intervals, with gaps between structures constituting between 35 and 65 percent of the length of the row. Given this assumption, the FRA model attributes a 3 dB reduction at the first row of buildings at 200 feet from the tracks, and 1.5 dB reduction for each succeeding row at 400, 600, 800 and 1000 feet. It is important to understand that the national average configuration of buildings is not meant to model any specific neighborhood.
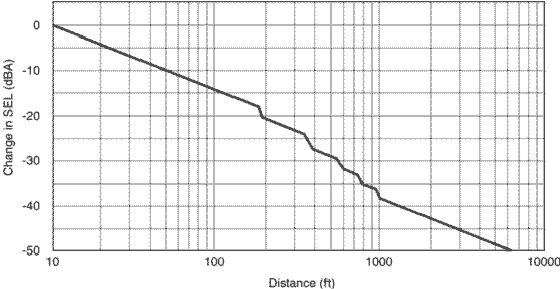
Figure 6. MODEL OF SOUND PROPAGATION FROM NOISE
Noise impact criteria used by FRA are based on noise exposure increases. Consequently, the existing noise exposure at every grade crossing must be estimated for in order to compare future noise exposure from the sounding of the locomotive horn. Trains are assumed to be the dominant existing noise source in the immediate vicinity of the tracks. The train noise Ldn depends on the number of trains traversing the area day and night. At some distance from the track, however, a general ambient noise level is attained which is characteristic of the general ambient environment away from the influence of incidental railroad noise. According to U.S. Environmental Protection Agency, the typical ambient level in a suburban residential area is Ldn = 55 dBA and in an urban residential area is Ldn = 60 dBA. These levels represent the noise "floor" in the noise impact calculation method.
The noise model computes the horn noise in terms of Ldn as a function of distance from the tracks, and the train noise without horns as a function of distance down to a noise floor established by the existing ambient noise. The two resulting curves are compared at each distance until the noise impact criteria ratings of "Impact" and "Severe Impact" are reached. Since the original source model was a polygon with 5 sides, the impact areas will be similar polygons. An example of noise impact areas is shown in Figure 7.
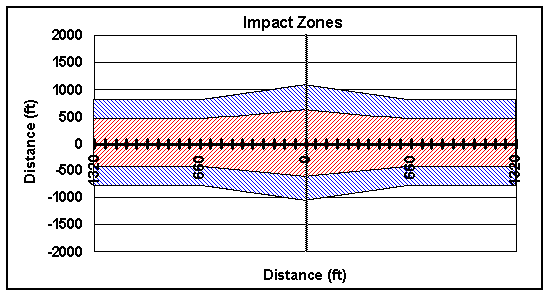
Figure 7. EXAMPLE CALCULATION FOR A SUBURBAN GRADE CROSSING
